Case Study: St. John’s Village
For an example of the questions that should be asked, we can use the case of St. John’s Village, a shelter of 19 beds primarily for veterans. Its FY 2025 budget was $512,000; it served a total of 45 individuals, and out of 30 exits, 13 (43%) were to permanent housing. In summary, it spent $27,000/bed, much less than average, and had 43% “successful” exits, much higher than average.
DHS does not ask the obvious question: What are they doing right? Is it how they select incoming participants? Veteran benefits? Better use of housing assistance workers? Their mix of services? The quality of their service staff? Or something else? And most importantly, can whatever it is they are doing right be implemented at other shelters?
Our Conclusions and Recommendations
The DHS report required a lot of time, money, and effort to compile, and it is the first attempt we have seen at a cost-benefit analysis. However, it does little other than show the current system is not working. A 16% “success” rate at a cost of $114,000 per “success” is not good.
The purpose of a cost-benefit analysis of the 31 shelters is to identify those that are underperforming and, using the examples of those that are better than average – like St. John’s Village -- to help the others improve. By simply accepting the wide mix of services offered by the various shelters and making no attempt to evaluate how effective those services are at each shelter, the report leaves no way to evaluate or improve shelter performance.
Our recommendations include:
● Make a standard list of services that each type of shelter must provide and evaluate how they are delivered.
● Include Behavioral Health/drug and alcohol addiction data for individuals and shelters.
● Develop an Individual Recovery Plan for each individual and evaluate service providers on how effective they are in moving the individual along that path, recognizing that for many individuals, there will be several steps between homelessness and permanent housing.
● When calculating the cost part of the cost-benefit analysis, use the true costs by including capital and maintenance costs incurred by the county along with operating costs.
Sources:
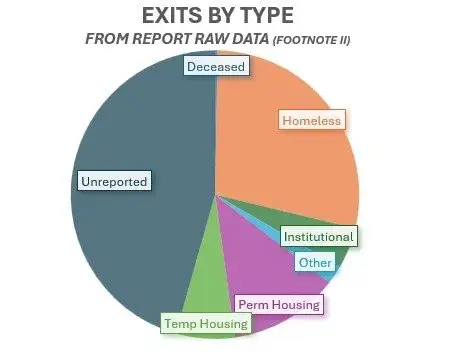
[1] There are several inconsistencies between what the report states and the raw data provided at the end of the document. For example, the report states on page 13 that there were 5,213 total exits. On page 35, it states there were 5,856. Adding up the raw data shows there were 6,910 exits. There is no explanation of the discrepancies. The exit percentage depends on the denominator you use.
[2] The chart is based on summing up the raw data provided for each shelter. Spreadsheet is available on request
[3] The 31 shelters had $98 million in operating costs, and the report claims 857 exits to permanent housing = $114,000 per exit. The $98 million does not include the costs of the permanent housing, nor does it include the capital and major maintenance costs of the shelters.